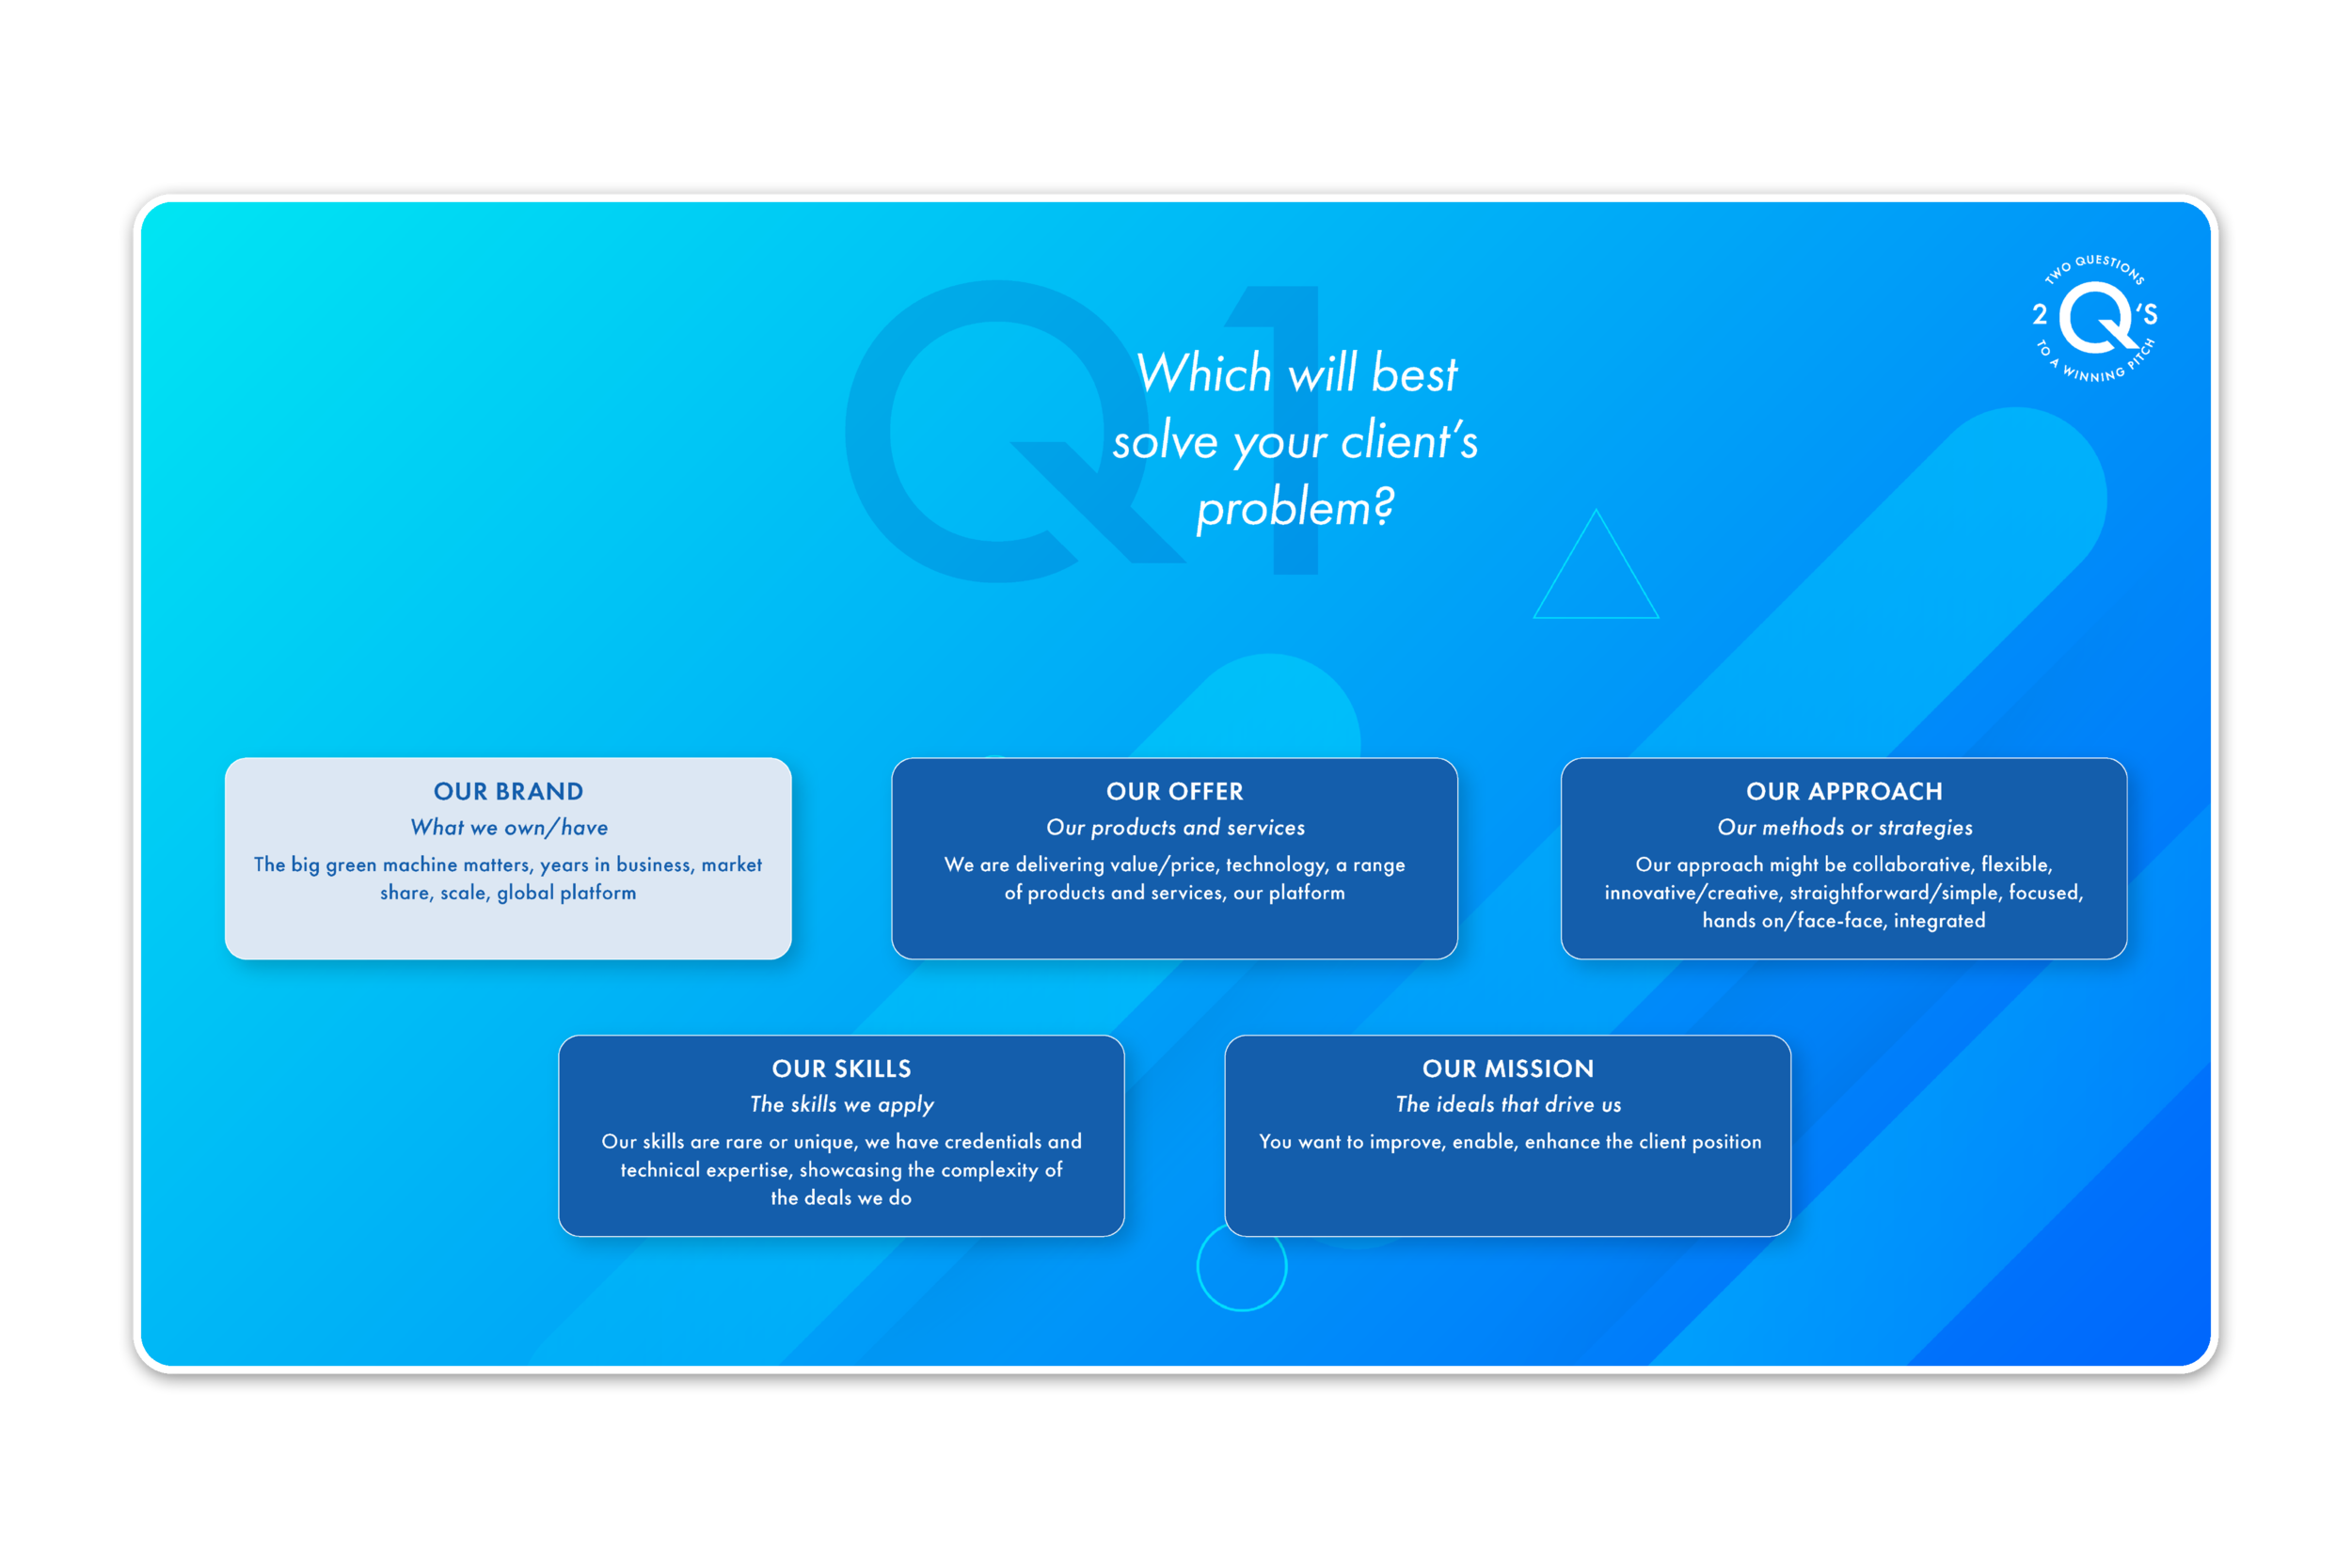
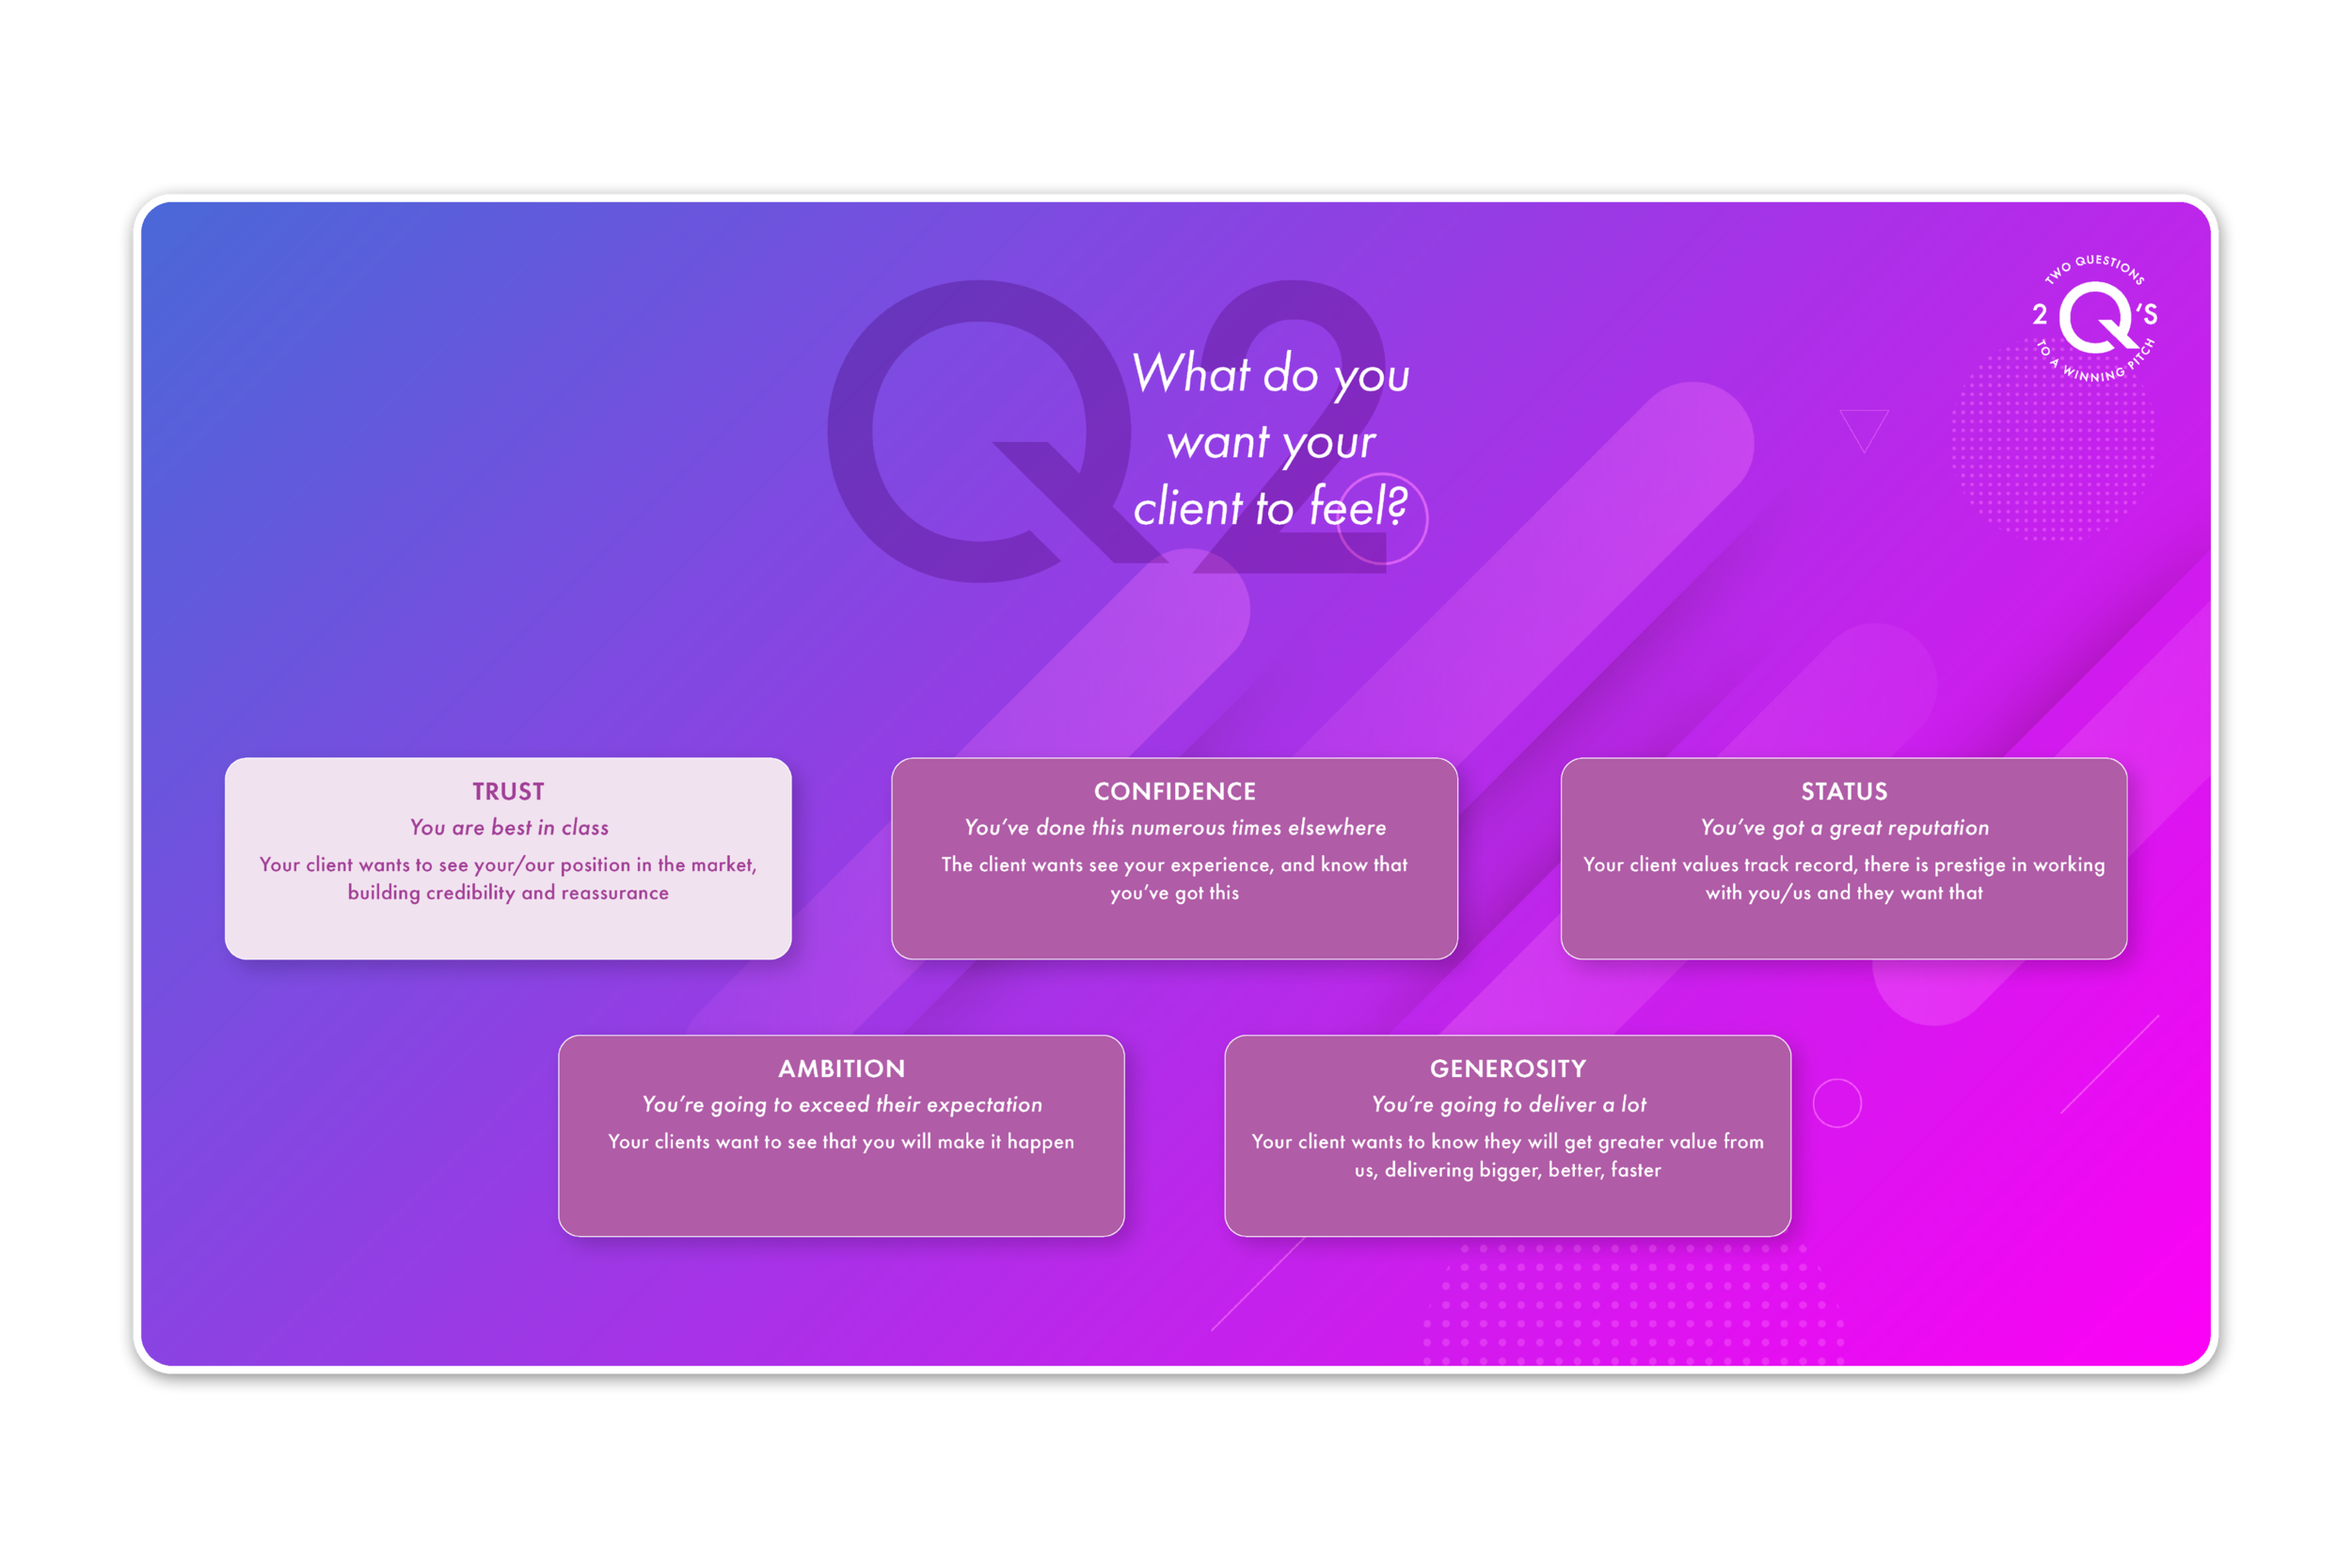
We created a business development tool that helped staff frame a client’s problem and provides the framework and methodology to solve it. A simple two-question process.
My role
UX/UI Design
User Research
Journey Mapping
Wireframing
Information Architecture
Design Systems
Design QA
Company
CBRE
Team
Product Lead
UX Designer
UI Designer
Research
Content Writers
Developers
Context
The Growth Platform is an internal business development group. Comprised of research, digital solutions, client engagement, sales & pursuit management teams, focused on building products and services that deliver success and solutions for CBRE’s clients. Through agile workshops, the group identifies multi-business line pursuits and opportunities in which to leverage its products and services for revenue-generating success. Consistently gathering feedback and intel on new market products and disruptions feeds this back into its offering. One of these products is the 2 Questions Tool.
The Problem
With over 1,800 employees and more than 25 different business lines across Australia and New Zealand, everyone has a different approach to success. The business has brokers at varying levels of experience and expertise. The business did not have a clear way of understanding client problems or delivering tailored solutions. Teams relied on fragmented tools, customer reports, and hefty Powerpoint presentations for gathering and sharing data. The process wasted valuable time, had a slow turnaround, leading to a ‘copy & paste solution’ from client to client, and left teams feeling unempowered with clients.
Goals
The primary goal was to design a streamlined dashboard experience for CBRE brokers to view templates, resources, data, and important insights across customer problems. The dashboard would serve as the MVP (Minimum Viable Product) and would be implemented in collaboration with Growth Platform’s development team.
The MVP solution would define the framework and visual style for an evolving suite of tools called the 2 Questions Tool, so it was essential to establish a flexible design system and component library which would allow for scalability. As part of the engagement, I would also maintain a backlog of post-MVP design tasks and provide CBRE brokers with feature enhancement suggestions.
Users
Initially, the dashboard would be used internally by CBRE's broker teams. These teams work with clients to deliver RFP (Request for Proposal) solutions and revenue-generating opportunities. The dashboard would then be rolled out to support teams who could self-serve performance insights, learn about building a Value Proposition and create solutions to engage more clients. These users are generally in marketing departments, from tactical people to the CMO.
Defining the Process
Working with my strategic team at CBRE, we broke the project down into four key phases, each comprised of important steps. This approach helped plan out the project roadmap and determine key milestones and deliverable dates.
With the tight timeline to MVP, working with an agile, sprint-based process allowed me to iterate on and validate potential solutions early and often. The Concepting phase repeated as a series of week-long sprints to work through different features.
Discovery & Analysis
To kick off the discovery phase, I met with CBRE senior stakeholders for a series of workshops to learn about their current workflow, set project goals, define the project roadmap, and whiteboard sketch high-level concepts. Then I conducted interviews with different user types across the company to understand their challenges and learn about their individual goals for optimizing their workflow.
Using the insights I gathered, I began to synthesize common themes. I developed persona profiles highlighting each unique user's tasks and goals, then created journey maps to understand relationships between different user types of the platform. These steps guided the development of low fidelity business flows to work out screen-to-screen interactions.

Concepting
I wireframed iteratively to define the information architecture of screens. I also explored various navigation approaches to determine the best experience for the user. I collaborated with CBRE senior stakeholders and users along the way to validate concepts and gather feedback to continue improving the experience.
Sprint Review Sessions
After each week-long sprint, I held review meetings with CBRE stakeholders to reflect on achievements from the previous sprint and identify areas for improvement. We jotted down points on cards in Figma, then collaboratively categorized and discussed our thoughts.
Review sessions were especially important because I was working remotely with CBRE’s teams in New South Wales and Victoria primarily, and I wanted to make sure everyone had the opportunity to share their perspective.

Design Solutions
The MVP solution is a secure web platform consisting of a primary dashboard and a side-by-side tools and resources feature. Given the nature of the content, the UI is designed to be very visual and offer the user snapshots into some of the templated solutions. The solution would finally enable CBRE brokers to firstly frame and understand the client’s problem and then identify the CBRE offering appropriate as the solution. The power of the 2 Questions Tool provides a single source of information, a proven methodology, and the resources for success. Giving brokers back valuable time to focus on clients.
2 Question Process
The tool started with two questions that helped brokers to build a value proposition. Defining what at CBRE would best solve the problem and understanding what we wanted clients to feel about our solution. These two answers combined provided a short mission statement on which the framework of their response could be built.


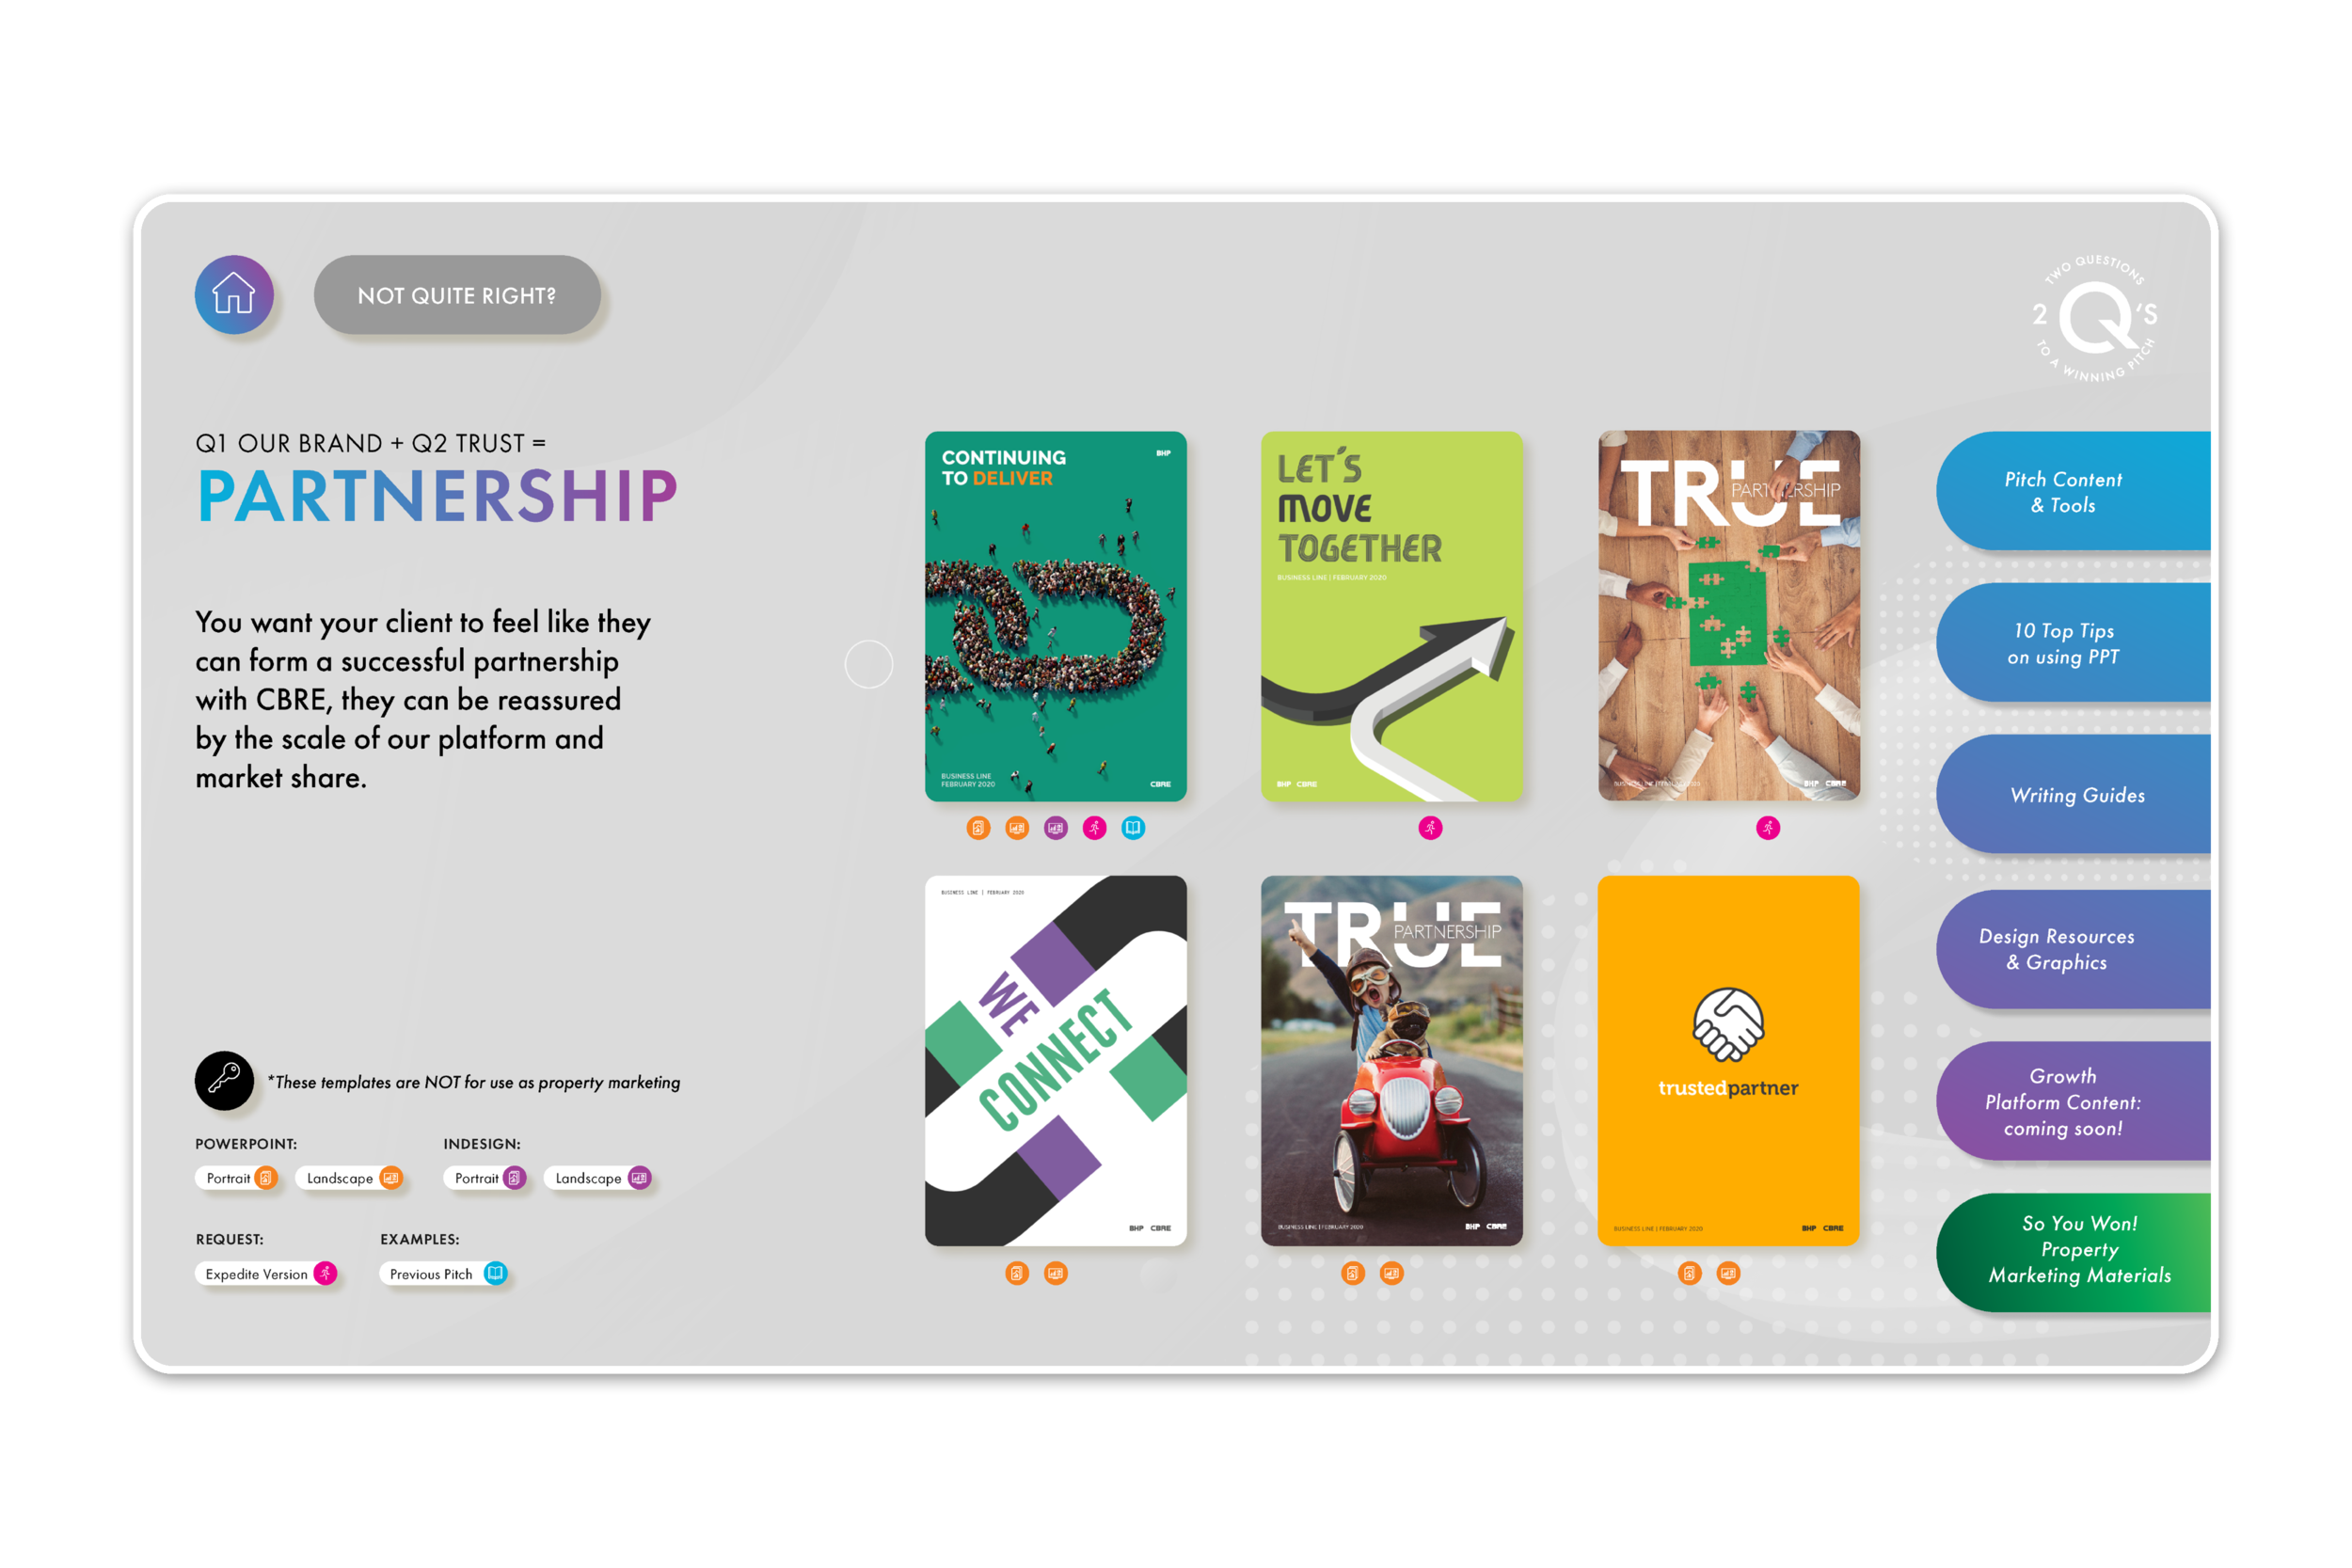
The main dashboard comprised a single space with templates, tools, and resources necessary to create and build a response document for a client. Templates were available in different sizes to respond to print and digital requirements. As well as being in different formats like Powerpoint and Indesign.
We provided previous examples where appropriate and a request form for any assistance or for a template to be expedited.
If the mission statement didn’t quite fit the solution, then users could easily jump to a matrix of all the possible answers and combinations of the 2 Questions. For example, if ‘Partnership’ wasn’t the right fit maybe ‘Dependable’ would better suit your solution. Giving users access to the right solution.


Success and Evolution
Launching the 2 Questions Tool product to internal users was a success, and stakeholders were excited about the solution. The 2 Questions Dashboard became integral to their team's workflow when engaging with clients and explaining the value of CBRE as a partner for success.
With the help of the tool, revenue has increased by 12.5% or $48m, and client retention is up to 76%. Some client feedback from work produced using the tool:
We were really impressed by the unique tailored solutions to our business requirements. CBRE really showed that they took the time to understand us and how we work and put forward some out-of-the-box ideas.
The 2 Questions dashboard laid the groundwork for the Growth Platforms evolving team. The design system and framework gave their team the tools they needed to continue building features to integrate with the other client solutions and products within the business.


